Question Protected by CommunityBot
Notice removed Canonical answer required by Django Reinhardt
Bounty Ended with CaulynDarr's answer chosen by Django Reinhardt
Yes it is. Please read the entire question.
Link
Django Reinhardt
  • 3.5k
  • 13
  • 45
  • 63
added 4 characters in body; edited title
Source Link
Django Reinhardt
  • 3.5k
  • 13
  • 45
  • 63

Making sense of Explaining the Stock Exchange in GTAV Stock Market

As a little experiment, I invested all of Franklin's money on the LCN in one company: Maze Bank. I then sent him to sleep over and over for a week (game time), checking his portfolio every time he woke up to see how the stock was doing. What I saw baffled me.
enter image description here

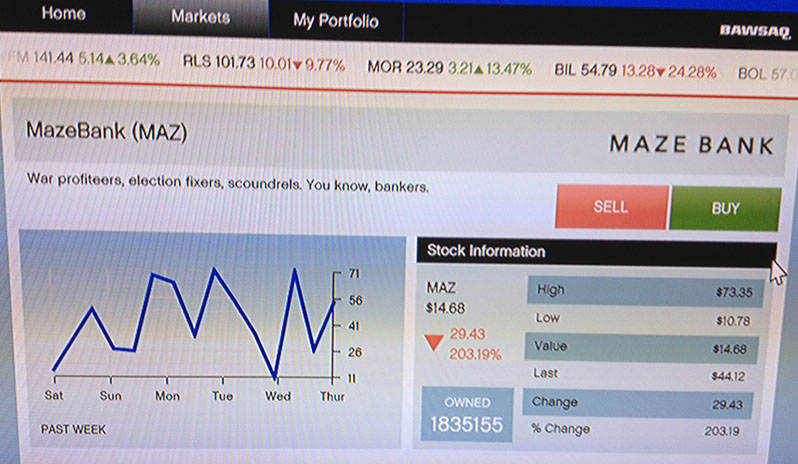
The stock fluctuated 1 or 2% for the whole week. I bought it at around $14.60 and it stayed within roughly a dollar of that figure the entire week.

The Graph
Firstly, the graph apparently reflects this past week, but it seems to say that the stock spent time at $70 a share, and was now resting at $56. In fact, according to the graph, it had only once dipped below $26 the entire week... Nowhere near the $14.60 figure I usually saw.

How am I reading the graph wrong?

Stock Information
On the right-hand side, the "Stock Information" seemed equally confusing. The "High" and "Low" seem to refer to the highest and lowest the stock had EVER been. (It certainly didn't reflect the week's fluctuations.)

"Last" (and thus "Change"/"% Change") didn't seem to reflect any price I saw over the period of a week, either. (Does anyone know what time frame the "Last" figure comes from?)

And that's only the LCN. Does the BAWSAQ have more accurate graphs/figures?Does the BAWSAQ have more accurate graphs/figures?

On the whole, all these graphs and figures seemed very confusing. Can anyone help make sense of them?

Making sense of the Stock Exchange in GTAV

As a little experiment, I invested all of Franklin's money on the LCN in one company: Maze Bank. I then sent him to sleep over and over for a week (game time), checking his portfolio every time he woke up to see how the stock was doing. What I saw baffled me.

enter image description here

The stock fluctuated 1 or 2% for the whole week. I bought it at around $14.60 and it stayed within roughly a dollar of that figure the entire week.

The Graph
Firstly, the graph apparently reflects this past week, but it seems to say that the stock spent time at $70 a share, and was now resting at $56. In fact, according to the graph, it had only once dipped below $26 the entire week... Nowhere near the $14.60 figure I usually saw.

How am I reading the graph wrong?

Stock Information
On the right-hand side, the "Stock Information" seemed equally confusing. The "High" and "Low" seem to refer to the highest and lowest the stock had EVER been. (It certainly didn't reflect the week's fluctuations.)

"Last" (and thus "Change"/"% Change") didn't seem to reflect any price I saw over the period of a week, either. (Does anyone know what time frame the "Last" figure comes from?)

And that's only the LCN. Does the BAWSAQ have more accurate graphs/figures?

On the whole, all these graphs and figures seemed very confusing. Can anyone help make sense of them?

Explaining the GTAV Stock Market

As a little experiment, I invested all of Franklin's money on the LCN in one company: Maze Bank. I then sent him to sleep over and over for a week (game time), checking his portfolio every time he woke up to see how the stock was doing. What I saw baffled me.

enter image description here

The stock fluctuated 1 or 2% for the whole week. I bought it at around $14.60 and it stayed within roughly a dollar of that figure the entire week.

The Graph
Firstly, the graph apparently reflects this past week, but it seems to say that the stock spent time at $70 a share, and was now resting at $56. In fact, according to the graph, it had only once dipped below $26 the entire week... Nowhere near the $14.60 figure I usually saw.

How am I reading the graph wrong?

Stock Information
On the right-hand side, the "Stock Information" seemed equally confusing. The "High" and "Low" seem to refer to the highest and lowest the stock had EVER been. (It certainly didn't reflect the week's fluctuations.)

"Last" (and thus "Change"/"% Change") didn't seem to reflect any price I saw over the period of a week, either. (Does anyone know what time frame the "Last" figure comes from?)

And that's only the LCN. Does the BAWSAQ have more accurate graphs/figures?

On the whole, all these graphs and figures seemed very confusing. Can anyone help make sense of them?

Tweeted twitter.com/#!/TheArqade/status/390292879102713856
Notice added Canonical answer required by Django Reinhardt
Bounty Started worth 200 reputation by Django Reinhardt
added 79 characters in body
Source Link
Django Reinhardt
  • 3.5k
  • 13
  • 45
  • 63
Loading
Source Link
Django Reinhardt
  • 3.5k
  • 13
  • 45
  • 63
Loading