24

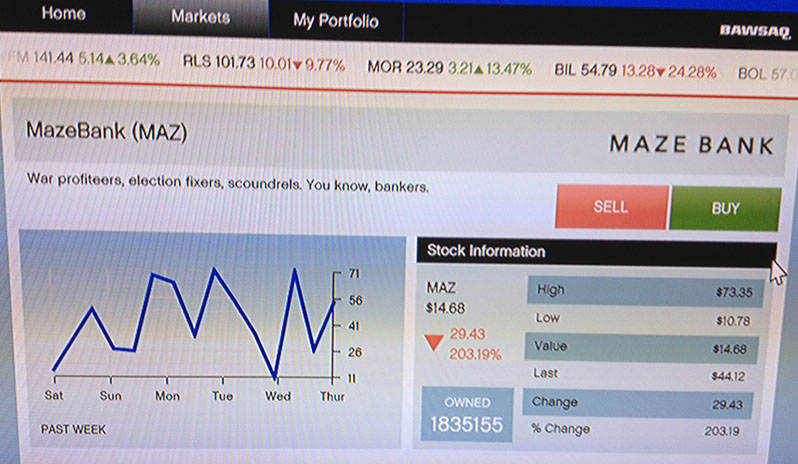
As a little experiment, I invested all of Franklin's money on the LCN in one company: Maze Bank. I then sent him to sleep over and over for a week (game time), checking his portfolio every time he woke up to see how the stock was doing. What I saw baffled me.
enter image description here

The stock fluctuated 1 or 2% for the whole week. I bought it at around $14.60 and it stayed within roughly a dollar of that figure the entire week.

The Graph
Firstly, the graph apparently reflects this past week, but it seems to say that the stock spent time at $70 a share, and was now resting at $56. In fact, according to the graph, it had only once dipped below $26 the entire week... Nowhere near the $14.60 figure I usually saw.

How am I reading the graph wrong?

Stock Information
On the right-hand side, the "Stock Information" seemed equally confusing. The "High" and "Low" seem to refer to the highest and lowest the stock had EVER been. (It certainly didn't reflect the week's fluctuations.)

"Last" (and thus "Change"/"% Change") didn't seem to reflect any price I saw over the period of a week, either. (Does anyone know what time frame the "Last" figure comes from?)

And that's only the LCN. Does the BAWSAQ have more accurate graphs/figures?

On the whole, all these graphs and figures seemed very confusing. Can anyone help make sense of them?

21
  • 13
    The chart is complete crap, used for illustration. Not based on real numbers in the game.
    – TZHX
    Commented Oct 13, 2013 at 17:12
  • 1
    @TZHX Seems really strange that they would do that. The graph is consistent, and each new day adds to the existing data of the previous days. Why not just randomize it every time you visited it? If they're going to create a persistent graph, why not use the real data? :-/ Weird. Commented Oct 13, 2013 at 19:13
  • @TZHX Do you have a source on the graph being "complete crap", btw? The IGN guide suggests examining the graphs in order to spot trends: uk.ign.com/wikis/gta-5/Stock_Market Commented Oct 13, 2013 at 19:27
  • 1
    The IGN guide is a wiki, hardly reliable.
    – TZHX
    Commented Oct 13, 2013 at 19:34
  • 1
    @TZHX I agree that the IGN wiki cannot be considered reliable, but what's interesting is that I've contacted Rockstar support about the seemingly fictional graphs, and they directed me to the IGN guide for more information. They (R*) assert that the graphs are not fictional. Commented Nov 11, 2013 at 19:59

4 Answers 4

11
+200

Part of the problem here is that the LCN is not a true market. It's semi-random with scripted elements driven by events in the game. General consensus is that the graphs for LCN stock are just there to be pretty and don't ever change. I've heard, but haven't confirmed for myself, that the scripted events will change what the historical graph looks like temporarily to match the events the game describes.

I did an experiment to confirm this. I looked at the LCN page for Maze Bank. Then, without saving I jumped into online mode. After a few seconds, I next switched back to story mode. When I looked at the Maze Bank page again the history graph was completely different, but the current value was the same(well only a few cents off).

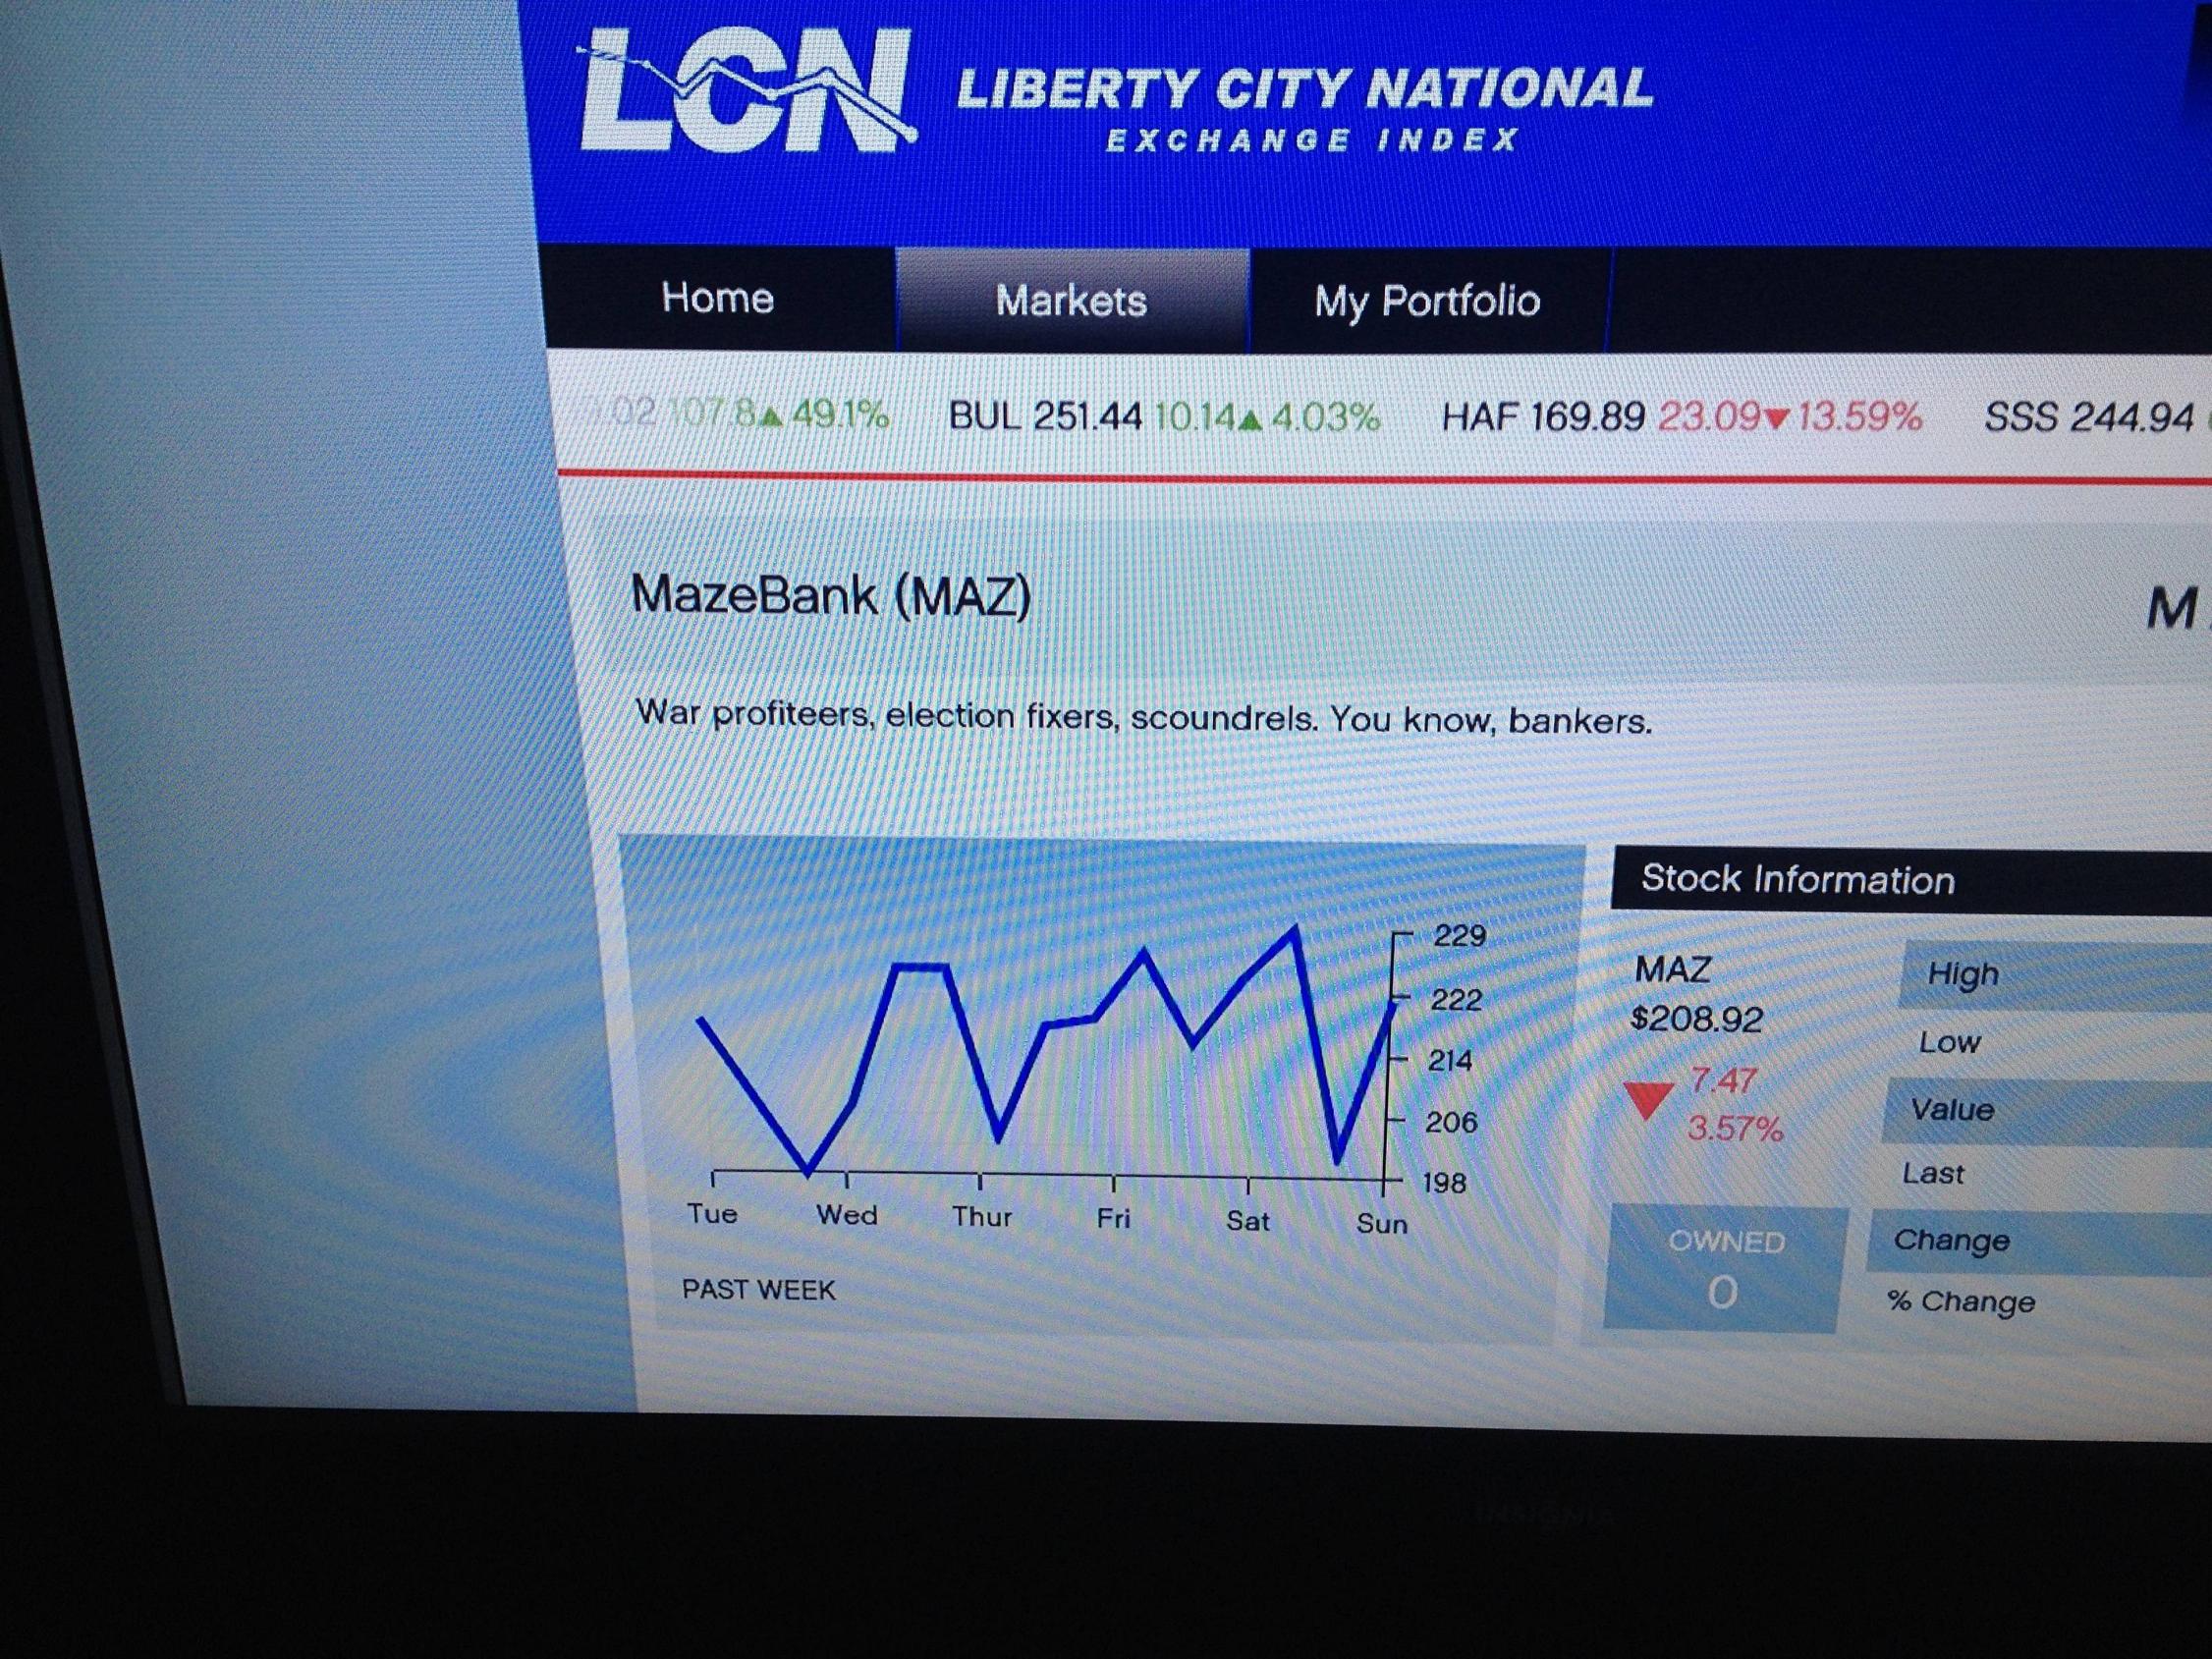
First Maze Bank Graph: First Maze Bank Graph

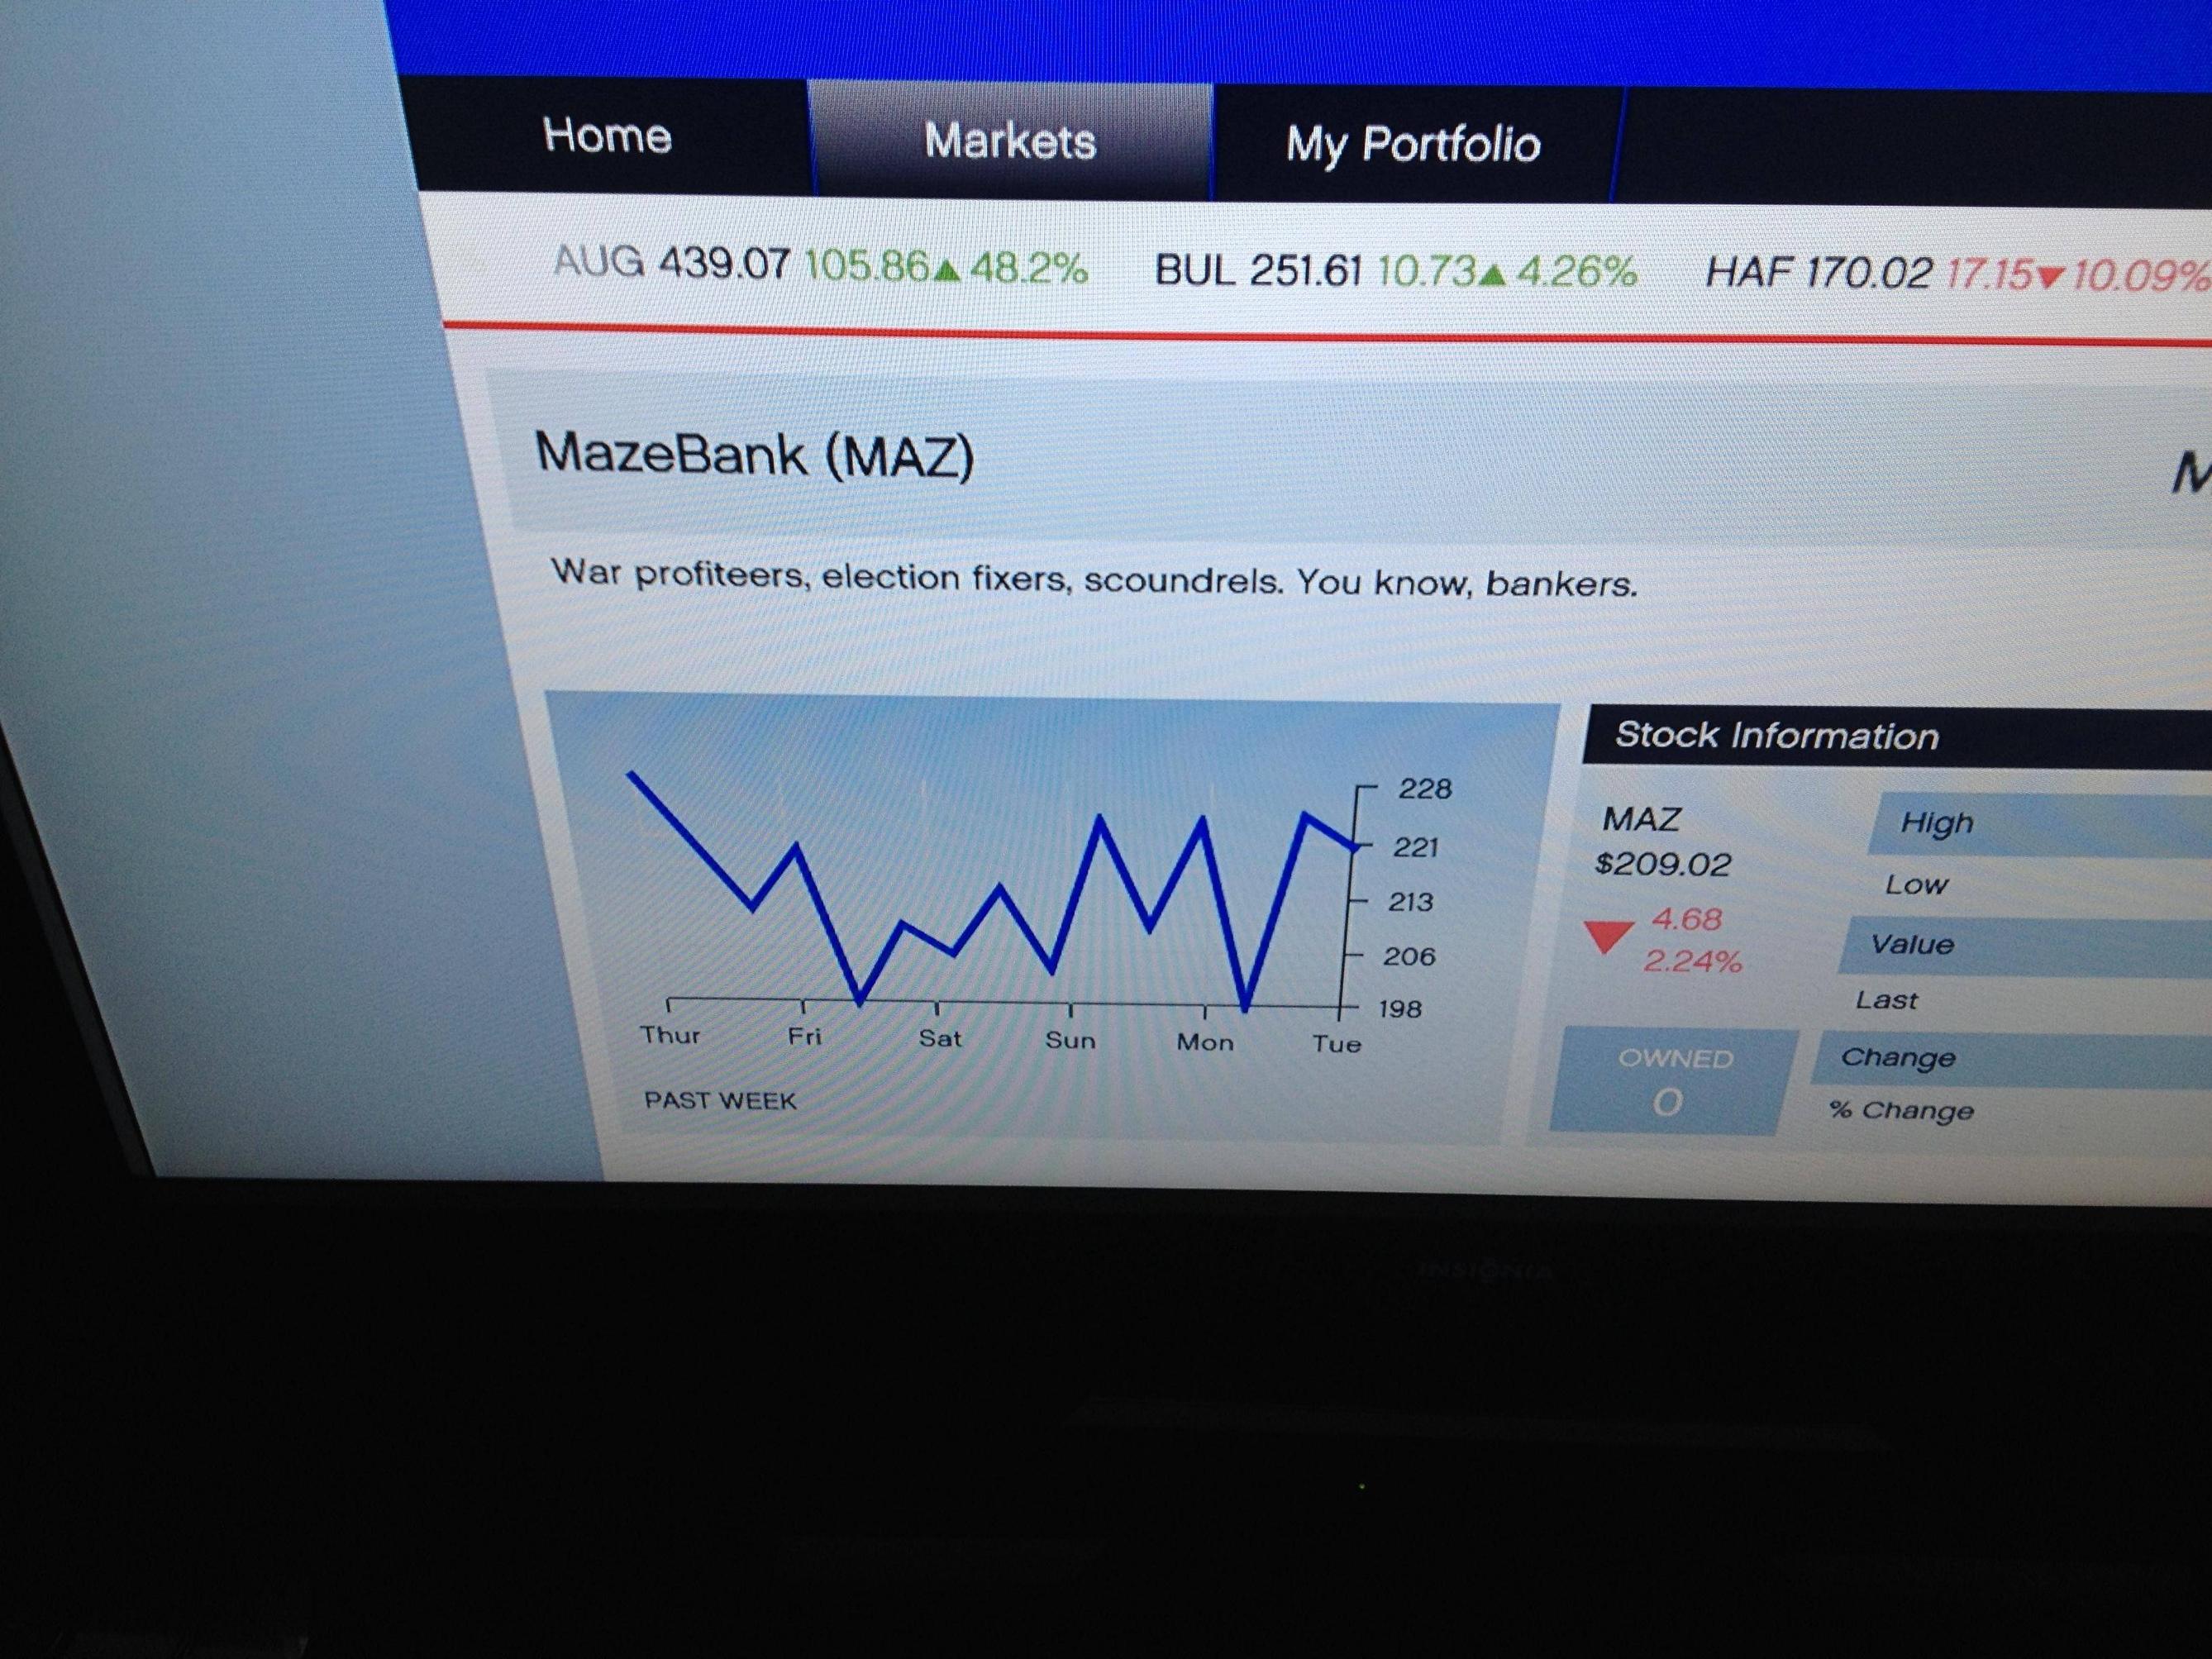
Second Maze Bank Graph: Second Maze Bank Graph

So, yeah, it's just random noise meant to sell the "realism" of the LCN exchange.

If the graph did make sense the values would mean:

  • High: The highest historical valuation of the stock.
  • Low: The lowest historical valuation of the stock.
  • Current: The current value of the stock.
  • Last: The value at the close of the previous day of trading
  • Change and %Change The change from the current price and the last value.

BAWSAQ works differently. It's semi-modeled to behave like a real market. All the players who buy stock effect the price so long as they have online access. How much they effect it is contentious. There have been a few organized pump and dump schemes, but the results are not quite obvious. This is why BAWSAQ has more sensible graphs that maintain an accurate history of the stock value.

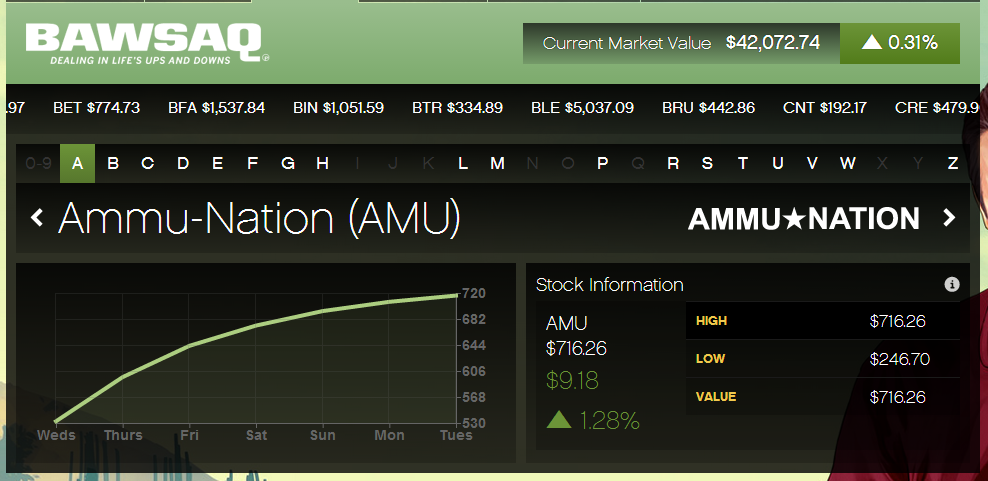
BAWSAQ graph from the social club site

6
  • Thanks for taking the time to look at the BAWSAQ. I don't see why the LCN being not a true market should affect the stats on the page, though. They're definitely there and they are programmed to behave a certain way -- so why not just take the stats and put them on the page? Commented Oct 22, 2013 at 18:47
  • 1
    Maybe it was just got to be too much data to track in the save files. Then they would have had to deal with how the market works over skipped time from missions and sleeping. Probably was just easier to throw some random stuff at the screen.
    – CaulynDarr
    Commented Oct 22, 2013 at 18:51
  • I could believe that, but it's only seven numbers in this format: xxx.xx for each of the 40 LCN companies. That's 1,700 bytes of data uncompressed! :-/ (And only 700 bytes compressed.) Commented Oct 22, 2013 at 19:02
  • Something else: the graphs are close to the actual value of the stock. Yours states 2xx whereas mine is 1x -- and both our graphs are in that region. I guess you're right though: It's window dressing. Commented Oct 23, 2013 at 21:13
  • 1
    This is extremely dissapointing.. I was feeling so stupid for having so much trouble trying to read the graphs.. Ironic that this factor of this super realistic game is super fake...
    – Karthik T
    Commented Oct 24, 2013 at 4:48
4

Django, I agree with you - the chart on each individual stock is at best difficult to decipher, and at worst meaningless. I own several LCN stocks on all 3 characters and, like you, I noticed that so far (over several in-game days - well over a week) they have moved very little, but their "details" page shows wild swings up and down each day. It's like there's some 100ms-long peak each day that if I just happen to be looking at the market in that instant, I'd double or triple my money.

Similarly, the Last and %Change don't make much sense much of the time.

So I can't answer your question, but I've decided to only pay attention to the High and Low numbers, and buy when a stock is within about 10% of the swing to the Low number. For example, if the low is $10 and the high is $100, then the swing is $90. 10% of the swing is $9, so I'll buy if the stock is between $10-19 (or if it goes below $10 of course).

I think the general consensus is that stocks WILL climb back towards their High value, so I have faith that eventually this will pay off. For the last couple of in-game weeks, though, all of my bought-low stocks are just staying low, with one exception. I bought VAG (insert your jokes about VAG here [insert your jokes about "insert" here]) at about $6 and I got 70,000 shares of it. It went up about $0.70 shortly thereafter which made me $40K or so.

Good luck.

1
  • Thanks for your (amusing) answer. What about the BAWSAQ? Commented Oct 21, 2013 at 21:29
4

LCN is not a very lucrative market outside of the assassination missions. BAWSAQ on the other hand can make you rich relatively quickly. I made $1.8 million with one of my characters in three days time. The graphs are very useful but alone they will only scare you or give you false hope. It's important to check in at the Rockstar social club. The in game charts for BAWSAQ only show the last five hours while the social club charts show the last week. Watch the social club charts for a stock that is crashing and compare it with the in game charts. When the stock reaches it's low point, and the in game chart show an uptick in stock value buy. From here on out its best to watch the social club charts but keep an eye on the in game charts for any sudden major drops. Also keep an eye on Pißwasser. It's is consistently lucrative. I bought in at $1.23 and sold at $24. Good luck.

Also in response to your initial questions "last" is the price of the stock before it last changed. You can't really say how often that is (some stocks linger at the same price for longer than others) but the information is useful and I will explain why in a minute. The "%change" is the % of the last recorded price that the difference of the new price and the original price is. This sounds confusing but it's really very simple. If a stock is $10 and jumps to $15 the %change is 50% because $10-$15 is $5 and $5 is 50% of $10. This is also useful and I will also explain why. Pay no attention to the high, it is the price of the stock when the game launched and most stocks don't get anywhere near their initial worth. I wish they would give us the average high price, but what are you gonna do? The low is very useful. When the price is at the low point BUY. It may drop a little but stay confident, don't sell, and wait for it to rise. Now for selling, and this is when those figures come into play. The "last" will not always be lower than the current price when a stock is on the rise. As long as the %change stays above -5% to -10% the stock will still likely rise. When comes time that you think you want to sell watch the I'm game graphs for a major down tick. If you follow these tips along with my other post you stand to make up 2500% increase on your initial investment, and that's just the most I've made so far. I think with the right stock I could make at least 5000% ROI (that's Return On Investment). The BAWSAQ graphs do reflect real market movement though, but both graphs are needed to make informed investments.

1
  • Great answer based on actual real experience! Thanks so much! Commented Nov 19, 2013 at 12:14
1

When it comes to LCN don't pay any attention to the graph. It's there to give you a general idea how the market is moving. So for instance it may be around the low and go up a dollar or two, on the graph it would look like it has made a huge jump, and in context it the rest of the market it has. Stocks rarely go up by that much at any given time. BAWSAQ models the real world stock market a little bit more closely. It is generally meant to be watched closely (so your entire play time consists of watching the market) because stocks only go up or down a small amount, but they change very often. Again the chart doesn't mean much. Your best bet when playing the market is to watch stocks and buy them at their lowest and sell whenever there is an increase. Never sell them when they are at a decrease at what you bought them at because they WILL go back up again eventually. One last tip: buy into cheap stocks, so after you do the missions LifeInvader trades at a low around 1.79 and at most goes up to 3.0 on a good upswing. If you buy into this you can purchase a lot of stocks and can potentially double your money, whereas most stocks will only give you a small amount of a return by comparison because you have fewer stocks overall.

Edit:one thing I forgot to mention, in the main menu of the stock market there are stories about things happening with businesses such as food poisoning at Burger Shot. Those are pretty good indicators on what stock is going to make a big change fairly soon, or has just made a big change.

2
  • The graph on the main LCN page is there to give you a general idea of how the stock market is moving, but not the image on the stock page itself. (It's worth noting that there are numbers on the side of the chart.) Also, you don't answer any of my questions about the numbers on the stock page. Good tip, though. Thanks! Commented Oct 18, 2013 at 5:36
  • You really don't need to worry about any of those. I believe last is the last highest price in the preceding week(LCN only). You just need to watch current prices against a stocks high and lows. If you look at a real life stock market they have all of that information with change %, and that fits into some equation that stock brokers do to guess where the market is going. I haven't looked too much at real stock exchanges to tell you more though. Commented Oct 18, 2013 at 11:26

Not the answer you're looking for? Browse other questions tagged or ask your own question.